Sample Results

See the evidence before you run a study

Every example below is rendered by the same report components the product uses for real studies — model-fit banners, executive summaries, utilities charts, pricing curves, and cross-tabs — computed live from small sample datasets. No screenshots, no retouching.

Everything on this page is labelled Sample data: the numbers are illustrative datasets, not client results. Base sizes (n=) are shown on every example, the same way the product shows them.

Conjoint analysis
Sample data

Which trade-offs drive plan choice?

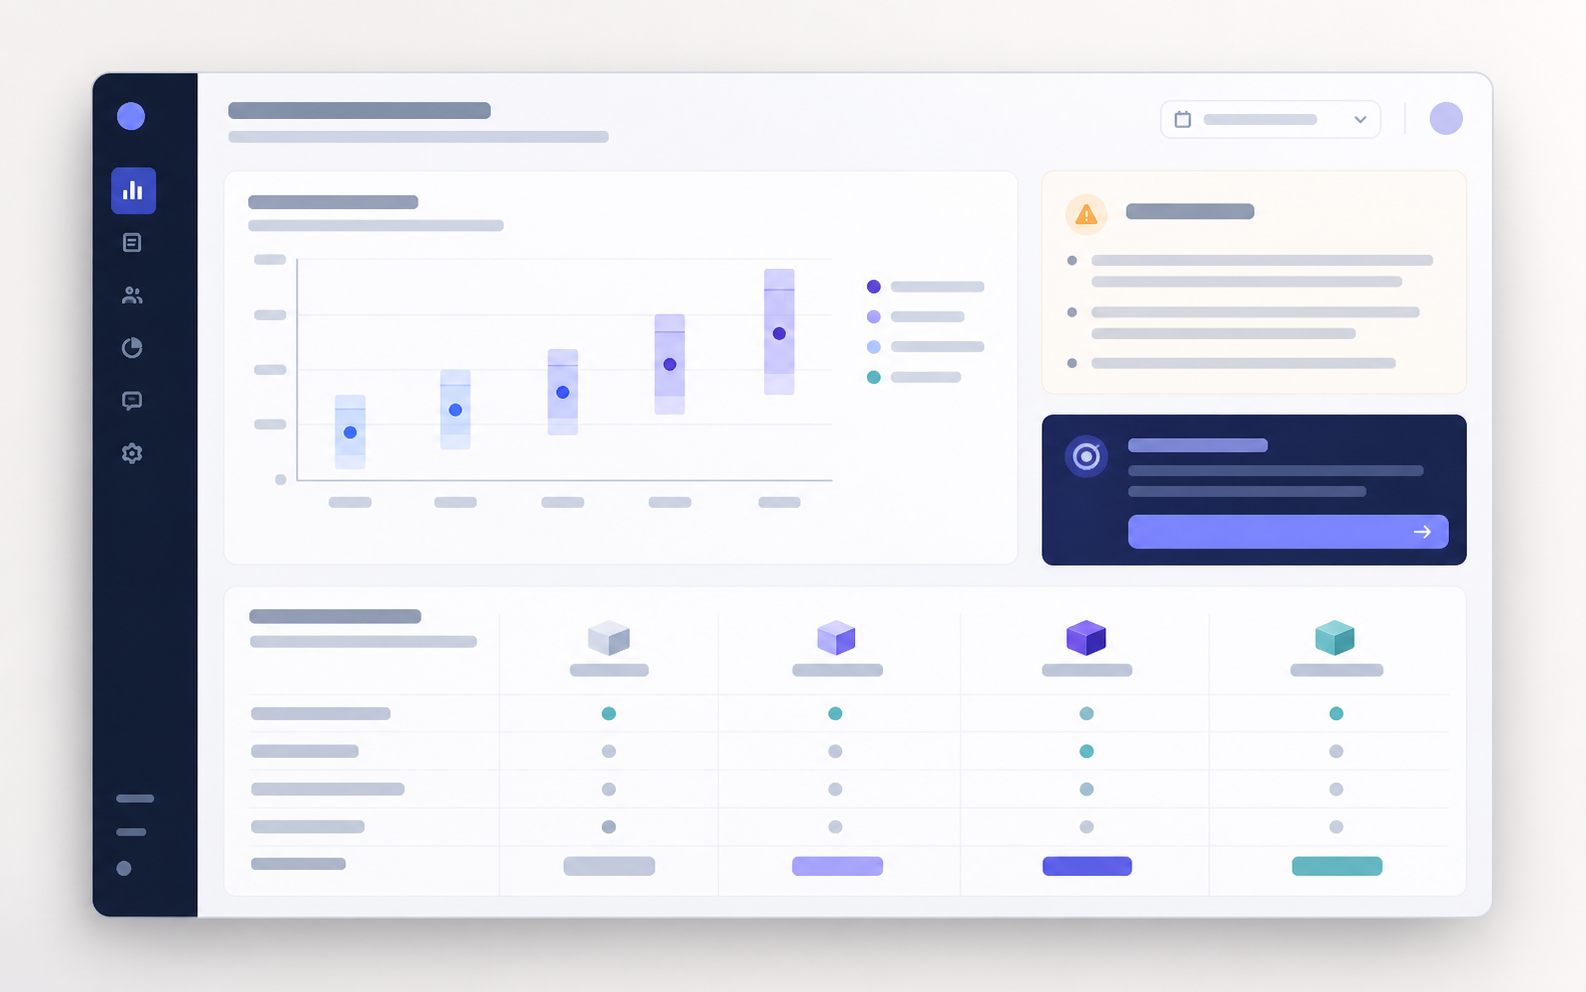
A choice-based conjoint study for a meal-kit subscription. This is the same model-fit banner, executive summary, and part-worth utilities chart that appear on the product's shareable findings pages — rendered live from a sample dataset.

n = 214Hit Rate 66.0%R² 71.0%Method: hb
Good
Key Findings
Auto-generated from analytics
  • Price is the #1 preference driver, explaining 39.1% of choice variance.
  • Respondents show the strongest preference for '$8.99 / serving' (Price). Utility: +0.64
  • Price sensitivity is active. Respondents penalise higher prices (price utility range: -0.73 to 0.64). WTP analysis is enabled.

Based on 214 respondents · HB estimation · Generated from analytics payload

Sample dataset · n = 214 respondents · experimental HB output · illustrative model fit R² = 0.71, holdout hit rate 66%. Figures describe this sample dataset only; they do not certify method validation.

Van Westendorp PSM
Sample data

What price range can we defend?

A Price Sensitivity Meter for a team analytics add-on, priced per workspace per month. The four cumulative curves and their intersection points (PMC, OPP, IDP, PME) come straight from the product's Van Westendorp report component.

Sample dataset · n = 186 respondents · four price questions per respondent · acceptable range $17.40–$22.50. Figures describe this sample dataset only.

MaxDiff
Sample data

Which features actually matter most?

A best–worst scaling (MaxDiff) prioritization of eight mobile-banking features. These illustrative normalized preference shares compare items within this sample. They are not choice-count ratios or purchase forecasts.

Sample dataset · n = 203 valid respondents · each respondent completed 10 best–worst tasks. Figures describe this sample dataset only.

NPS + cross-tab
Sample data

Where does satisfaction concentrate?

A quarterly NPS read broken down by plan tier, using the product's cross-tabulation table. Counts are shown per cell; NPS per tier is % promoters minus % detractors.

Free
+4NPS
n = 112
Starter
+25NPS
n = 114
Professional
+46NPS
n = 102
Enterprise
+42NPS
n = 84
NPS Category × Plan Tier (Sample) — respondent counts

Scroll horizontally to view all comparison columns.

FreeStarterProfessionalEnterprise
Promoters (9–10)38526149
Passives (7–8)41382721
Detractors (0–6)33241414

Sample dataset · n = 412 responses · smallest tier base n = 84 · product percentage guards suppress bases below 15 and flag 15–29 as low-base. Figures describe this sample dataset only.

Take findings like these with you

Results move out of the platform through clearly scoped export paths — each one labelled with its current availability.

CSV / Excel / JSON

Export structured response data for spreadsheet and BI workflows.

Live

PDF Reports

Generate formatted report outputs with charts and findings.

Beta

SPSS / R

Export statistical-package-ready files.

Private beta

PowerPoint / Share Links

Share presentation-ready or branded stakeholder outputs.

Planned

Why sample data?

We do not publish client results, and we do not dress up mock numbers as case studies. These datasets exist so you can judge the actual deliverable — the charts, the caveats, the base-size discipline — before you field a single question. Inside the product, demo datasets carry the same kind of explicit labelling.

Choose Your Method

Methods hub

Pick the right method for your decision

Pricing, prioritization, product configuration, satisfaction — a decision-first map of every method behind the examples above.

Analytics

The analytics behind every example

Cross-tabs, significance testing, base-size guards, and export paths — the reporting layer these sample results are rendered with.

Statistical honesty

Every chart shows its n

Sample sizes stay visible, thin bases are flagged, and caveats ship next to the numbers. See the standards these examples follow.

Ready to produce evidence like this?

Start free with a demo dataset, pick a template, and see your own results in these same reports.